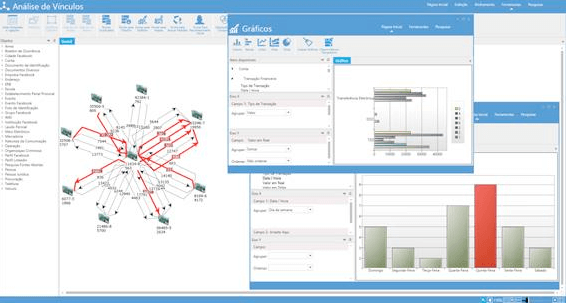
Caseboard software facilitates information analysis by providing a graphing tool that allows analysts to see different views of the same information, even analyzing parts of a graph and generating other sub-graphs of the same set of data.
Graphical analysis adds a differentiated view of the diagrams to the investigation of data, making it possible to analyze trends or specific behaviors, for example.
Like the other Caseboard features, the graphs are created and configured by the analyst himself, which means that he can apply all his expertise in analysis to the graphs and obtain the best results without the need to be a technology specialist.
Even during the creation of the charts, it is possible to apply filters and ordering to the chart content and include the sum of numeric values as a y-axis grouping. When dealing with temporal data, graphs can be created from groups of hours, days, days of the week, months, quarters, quarters, semesters, years, among others. The data analyzed in the graphs are integrated with all other Caseboard functions allowing, for example, that the data of a graph is highlighted in a diagram.
Charts can be created from a variety of data sources, including: